CDV ❯ admin console - are the graph labels for disk fault/flush right?
-
Bug
-
Status: Closed
-
2 Major
-
Resolution: Fixed
-
-
-
kkannaiy
-
Reporter: tgautier
-
March 15, 2008
-
0
-
Watchers: 0
-
February 12, 2013
-
March 28, 2008
Attachments
Description
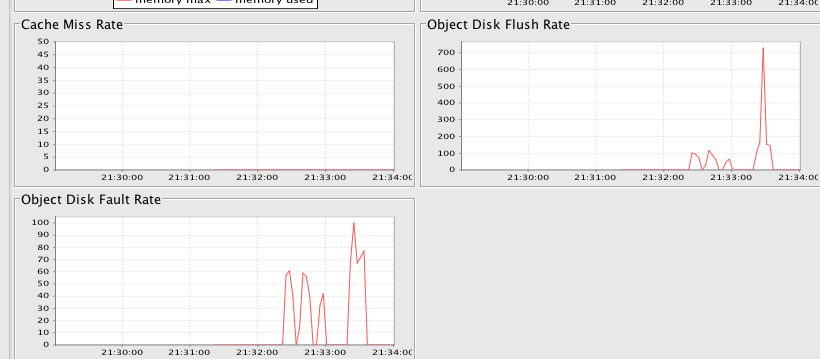
when I selected the server tab I see the disk fault/flush labels, but I am a bit surprised that there is disk fault/flush activity in the l2. I am just playing with the shared editor here and would not have expected disk flush / fault activity for such a trivial data size. are these graphs truly disk flush/fault?
Tested with Terracotta 2.6-nightly-rev7833, as of 20080331-190316 (Revision 7833 by cruise@WXPMO0 from 2.6), it is working as expected.
Actual: Object Flush Rate and Object Fault Rate graph labels are displayed